Creative Explorer

New Engen Creative Explorer

Overview

My Role | Director, Product Design (UX)

Tools | FIGMA, Newsprint & Ink Pens


Goal

How might we design a comprehensive reporting tool that provides marketing teams with actionable insights into ad performance? This tool should enable them to make adjustments to their campaigns, easily showcase the results, and compare ad and campaign performances against each other.

New Engen is focused on supporting cross-channel marketing experimentation, and builds tools to automate processes for creating and managing digital ad campaigns.

Problem:
Marketing Managers, Graphic Designers and Copywriters put a lot of work into creating ads for their marketing campaigns. After launch, it is very difficult and time consuming to track performance, and ads often perform differently on each of the digital platforms such as; Google Shopping & Display Network, Facebook, Instagram, & Pinterest.

They also want the ability to see and share the performance of all of their campaigns and quickly and easily report up the leadership chain the aggregate performance of different campaigns against different metrics.

Success: We were able to quickly assess our target users’ needs and, within just three months, create a tool that displays real-time performance, allows for easy customization, and clearly showcases results.

“Creative Explorer helps our team quickly determine key insights from paid social performance and clearly articulate the power of what we’re doing on a daily basis.”
- Director of Marketing and Brand Strategy, LA Clippers

Process

  1. UX Research
    • User Personas
    • User Tasks & Scenario
    • Design Studio
  2. UX Design
    • Concept Wireframes
    • Visual Design
    • Prototyping
    • Design System
  3. UX Testing
    • Usability Study & Test Plan
    • A/B Testing
    • First Run Welcome Tour
    • Next Steps

> 1. UX Research

User Personas


Maryia Marketing Manager
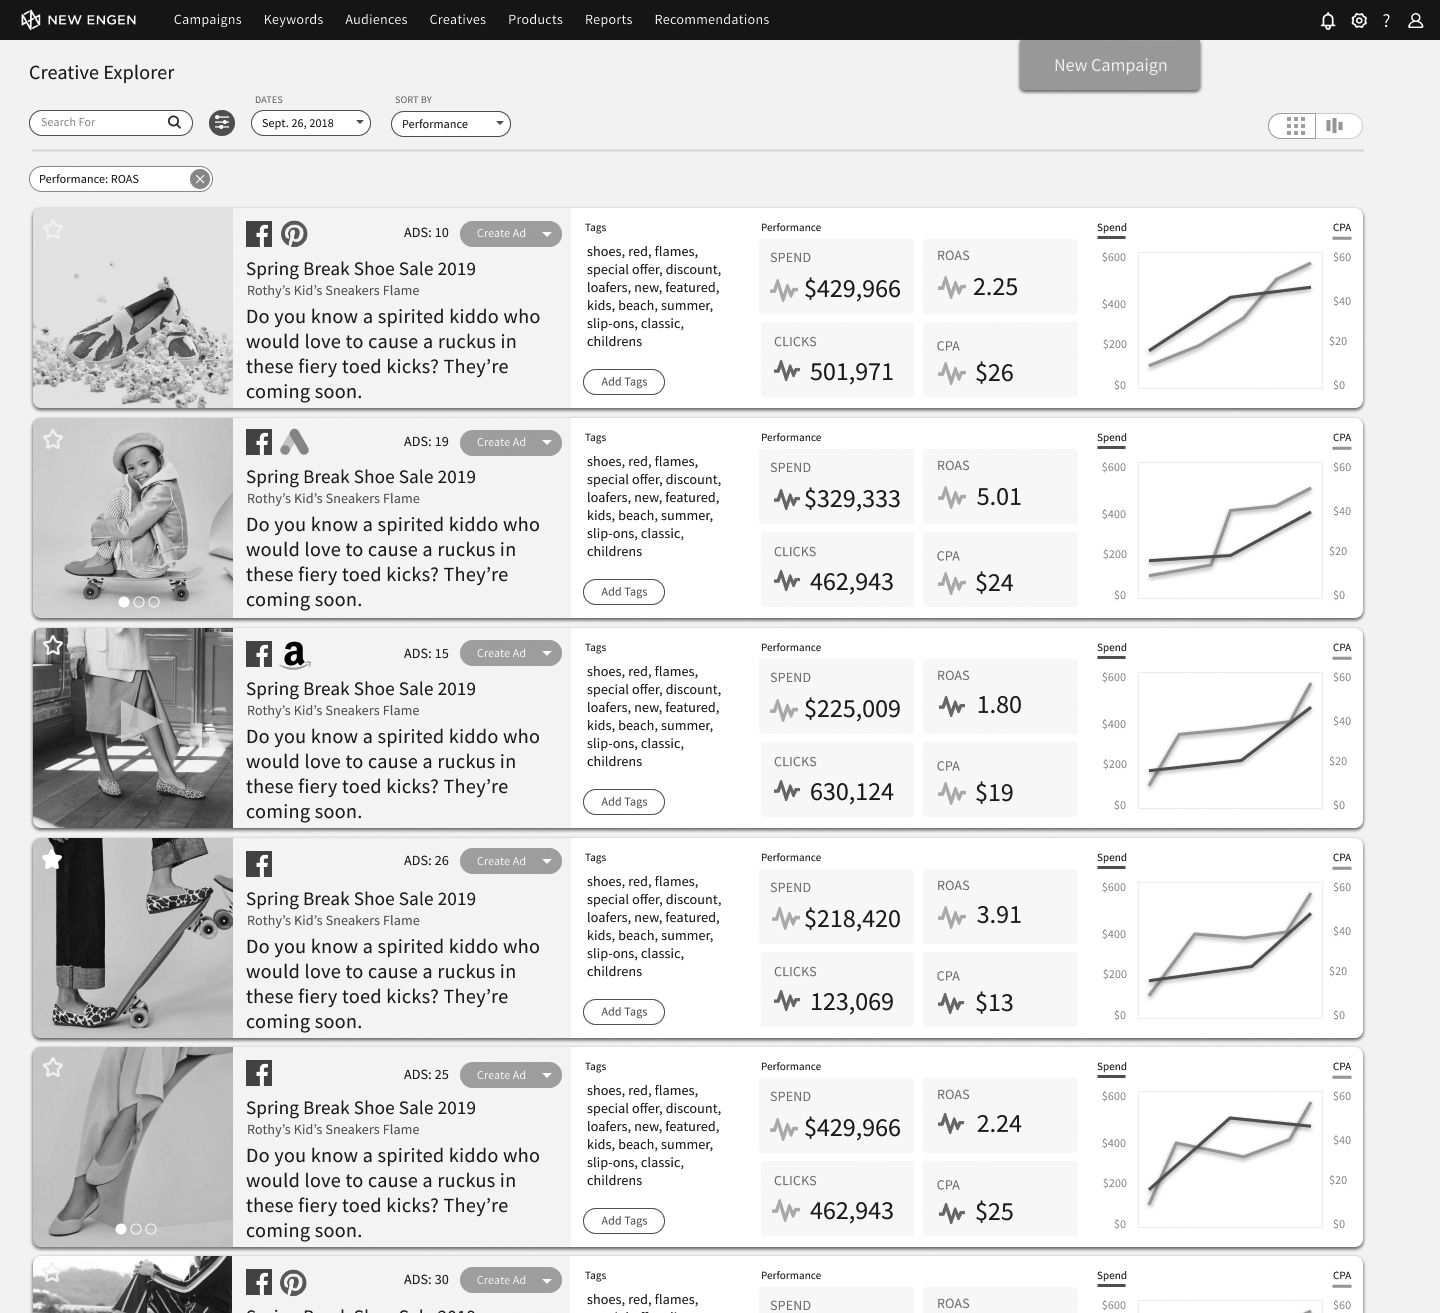
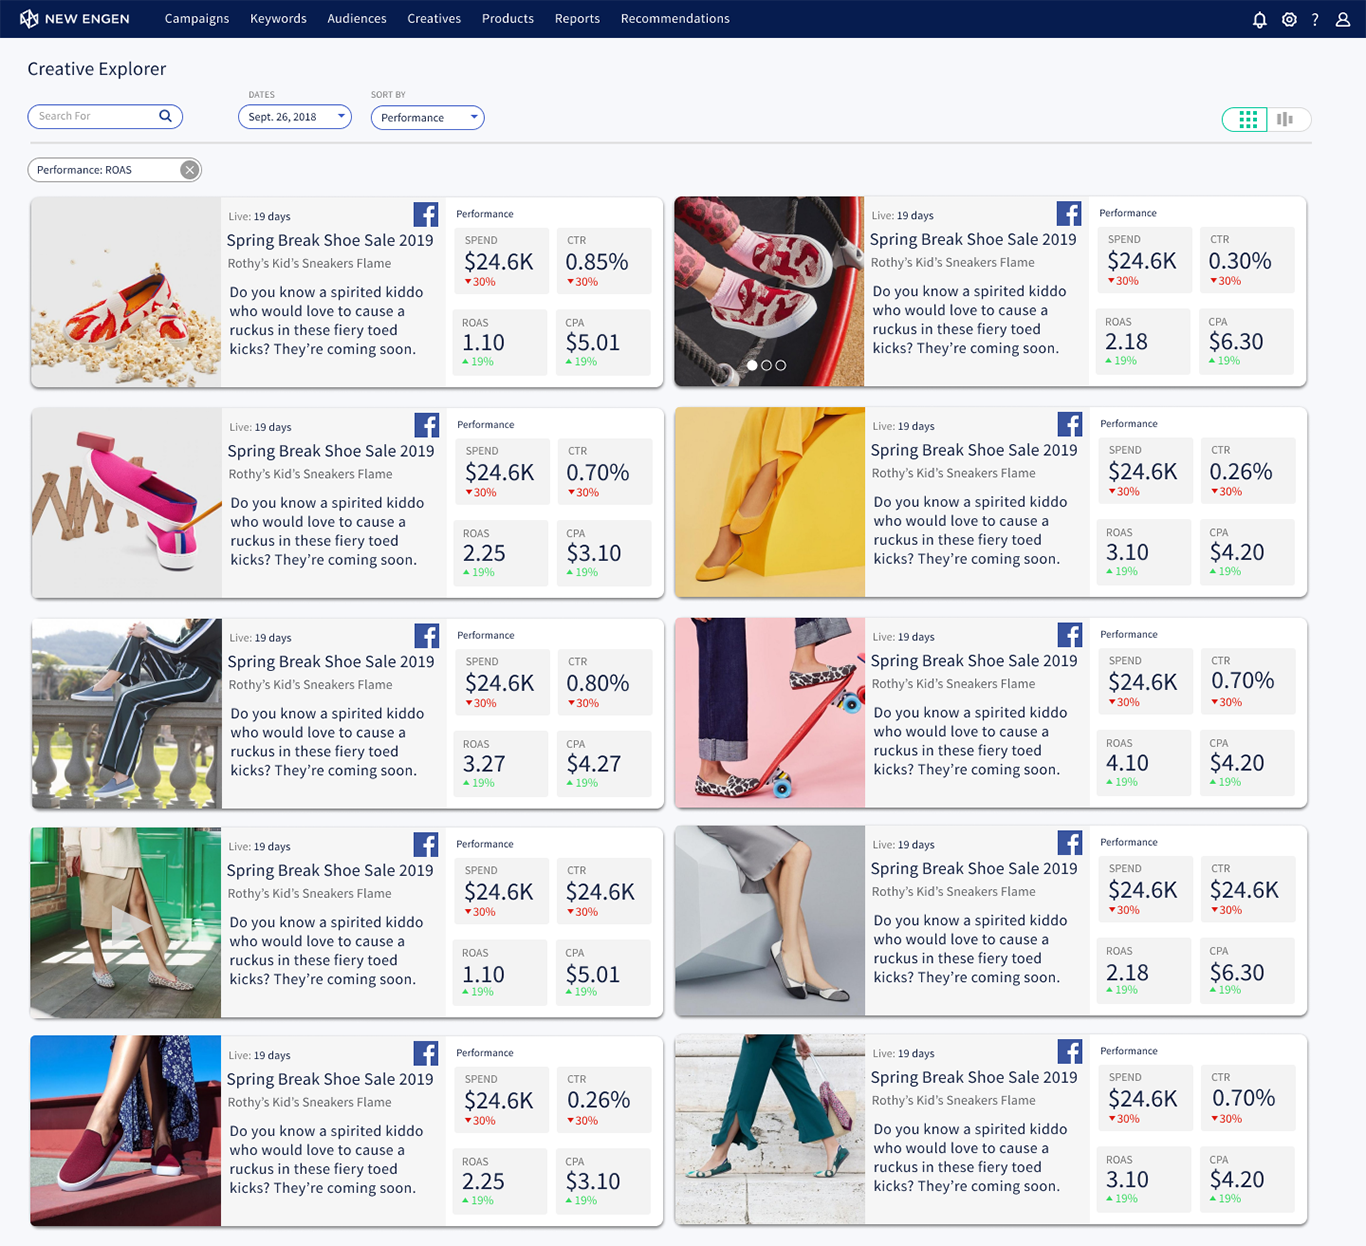
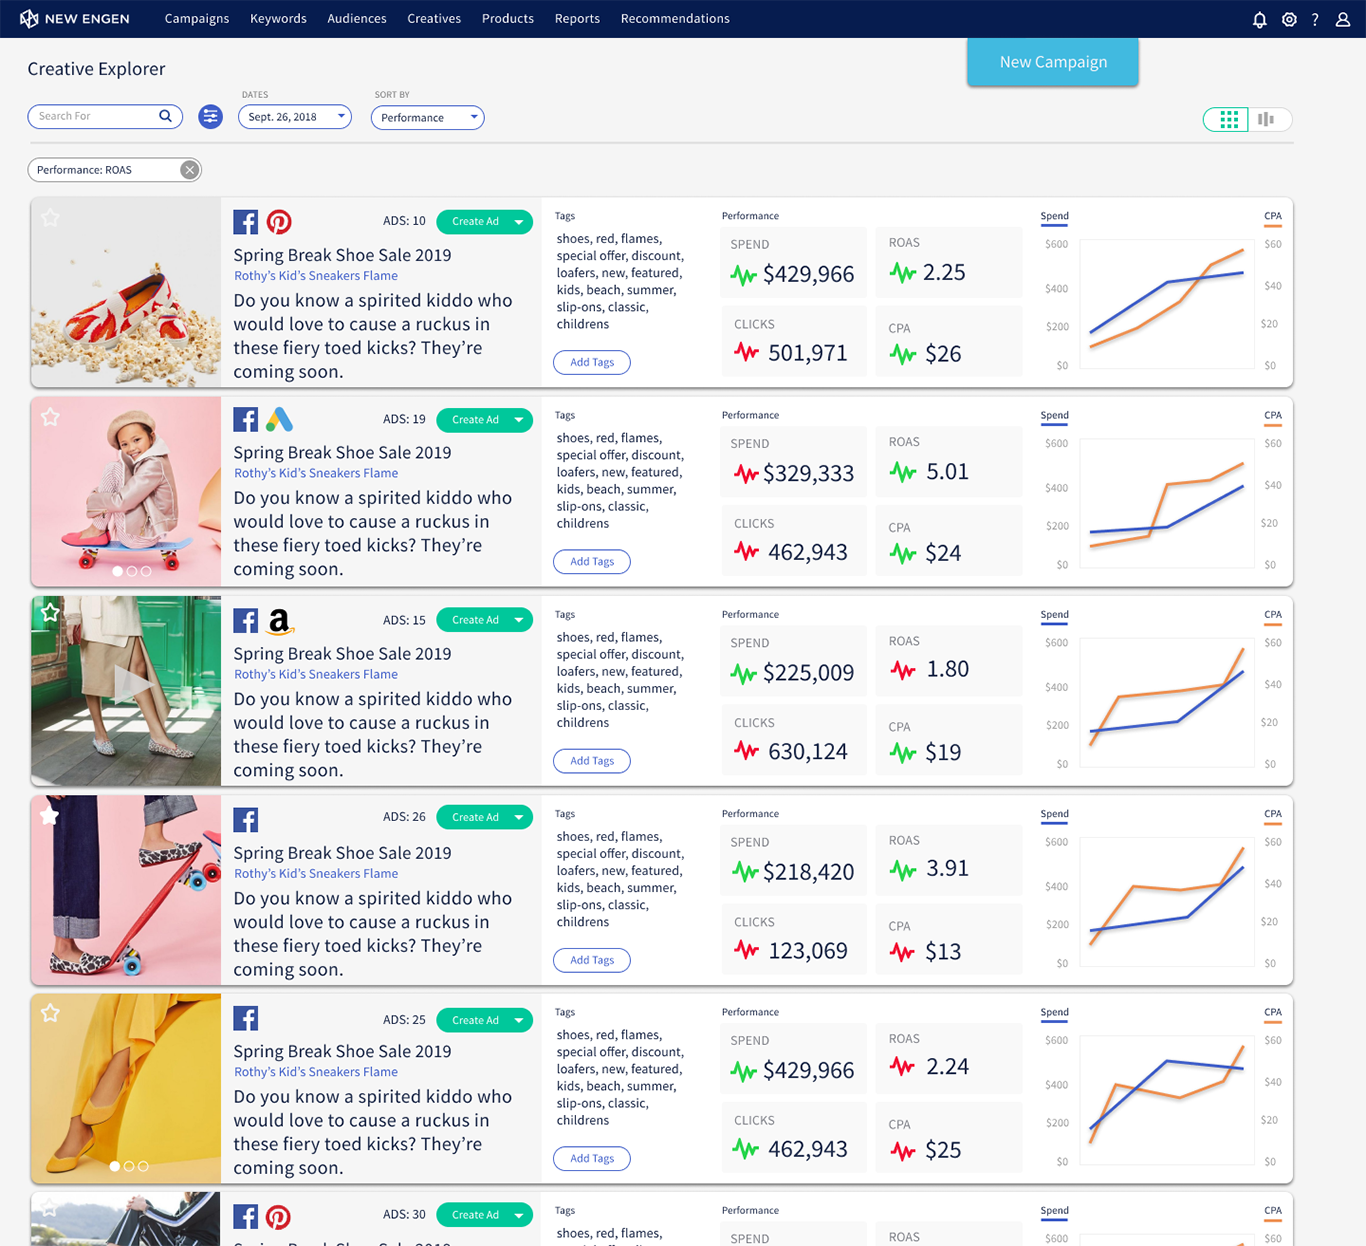
"I need a tool that shows me ad performance data with both the viusal creative along with hard numbers."


Graham Graphic Designer
"I put a lot of work into designing my ads and struggle to understand why some do well and other's don't."


Corinna Copywriter
"Different copy paired with different images can impact ad performance."


User Tasks & Scenarios

User Tasks

  • As a Marketing Manager, I need detailed performance metrics so that, I can demonstrate the ROI of my campaigns to secure future budget allocations.
  • As a Marketing Manager, I need access to historical campaign data so that, I can identify trends and make data-driven decisions for upcoming campaigns.
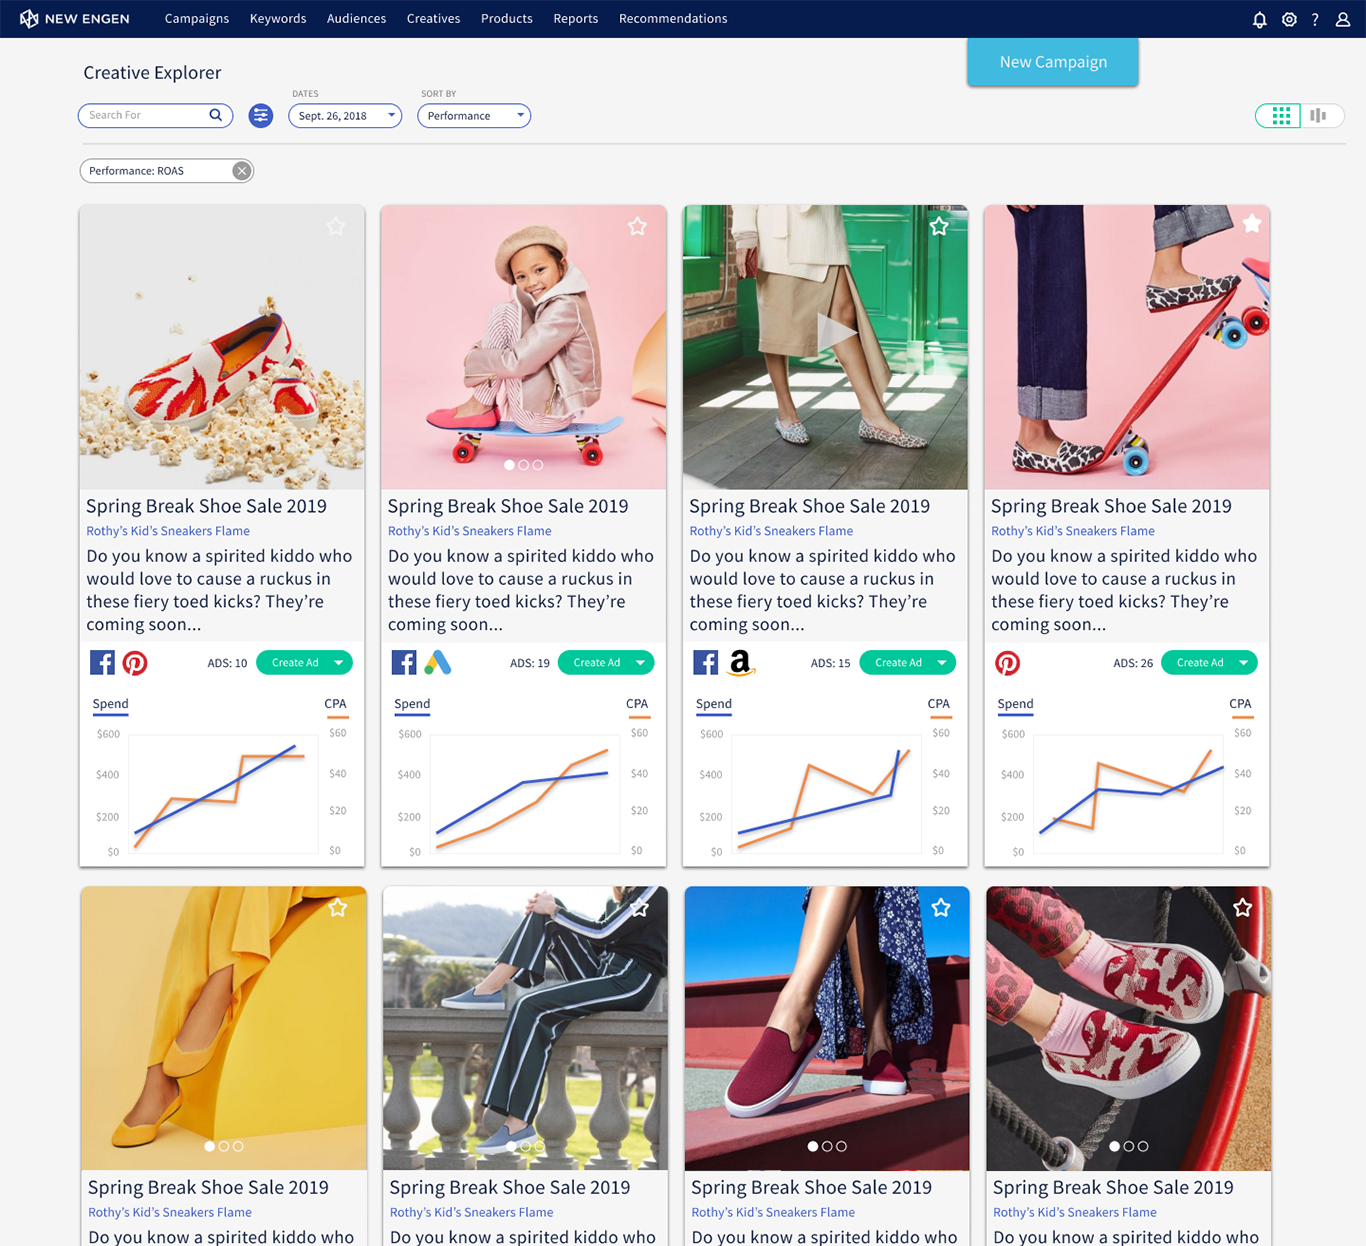
  • As a Graphic Designer, I need comparative data on different design versions so that, I can learn from the high-performing ads and replicate their success in the future.
  • As a Copywriter, I need insights into which copy and visual pairings resonate best with the audience so that, I can create more effective ad campaigns.
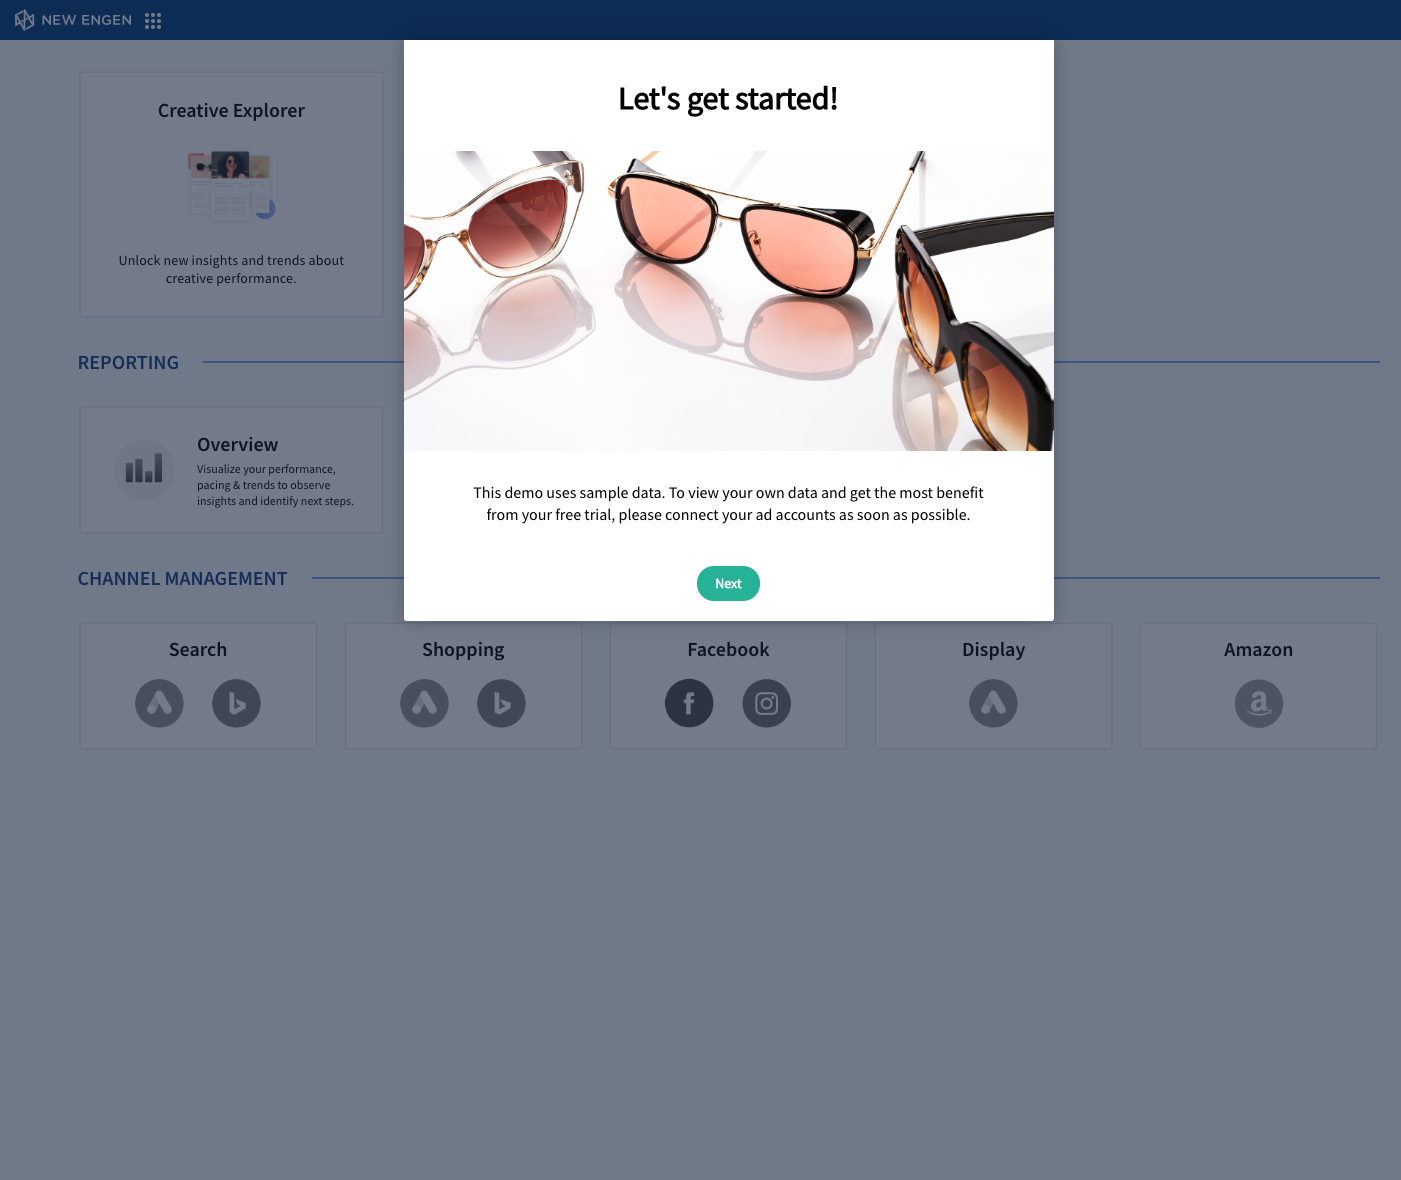
A day in the life of Maryia Marketing Manager

Maryia works for an eyewear company and she just launched a spring break campaign featuring a new line of sunglasses. On her bus ride into work she sips coffee and checks-in on how her digital ad campaigns performed on Facebook yesterday. Maryia prefers to look at the CPA (Total Ad Spend / # of Acquisitions) on her campaigns to determine the "health" of each ad. This morning she is happy to find that the CPA on all ads in the spring launch campaign are up 7.4% and on track to spend to the weekly budget she set.

Once Maryia arrives in the office she opens her laptop and dives deeper into the data. She specifically wants to see how the ads with headline copy containing the word "beach" performed. She notices the CTR is 26% higher on average, so she decides to increase both the bid and spend of these ads.

Maryia looks at the clock and notices she is late to a meeting with her "Google Shopping" counterpart. Once in the meeting she learns that the production facility is having issues and is unexpectedly running out of stock on their most popular frames. Maryia reduces the budget on ads pushing that frame and reallocates to ads that lead customers to the next best selling styles. Maryia repeats this process for her campaigns on Google Display Network and Pinterest, before she knows it, it's already 1:50. She grabs her purse and rushes out the door to try and make it to her favorite salad bar before it closes.
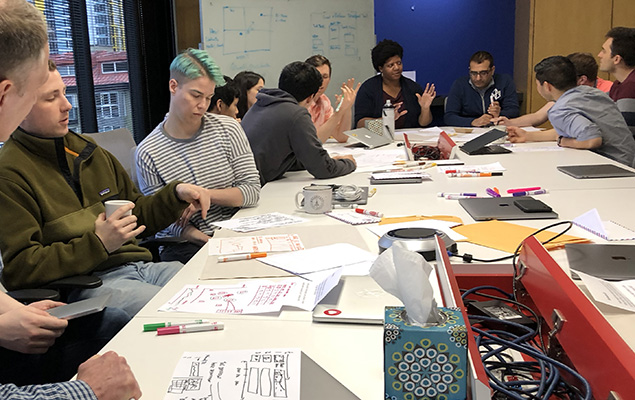
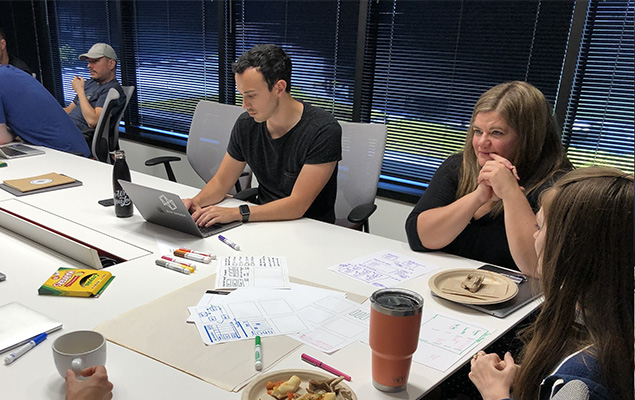

Design Studio

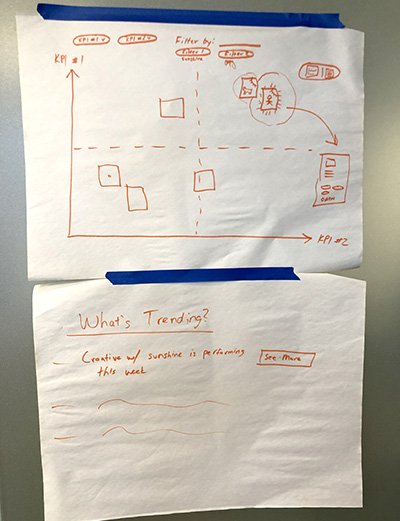
Leveraging our internal subject matter experts to tap into the team's collective knowledge I organized a brainstorming session that was specifically designed to cast the widest net possible.

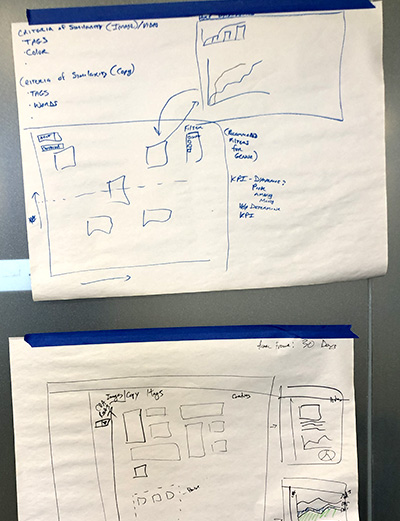
After sketching and discussing different options we landed on a direction to visually showcase ad performance reporting. Including all stakeholders such as; sales, marketing and engineering gave us insights to the opportunities and costs that we would need to consider when looking at both the interaction details and big picture strategy.

Design Studio
Design Studio
Design Studio
Design Studio
Design Studio
Design Studio


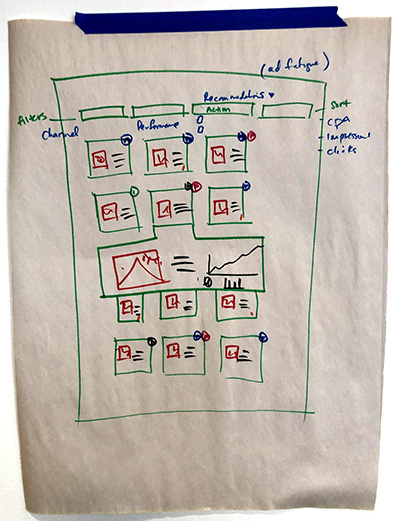
Brainstorming Session Outcomes

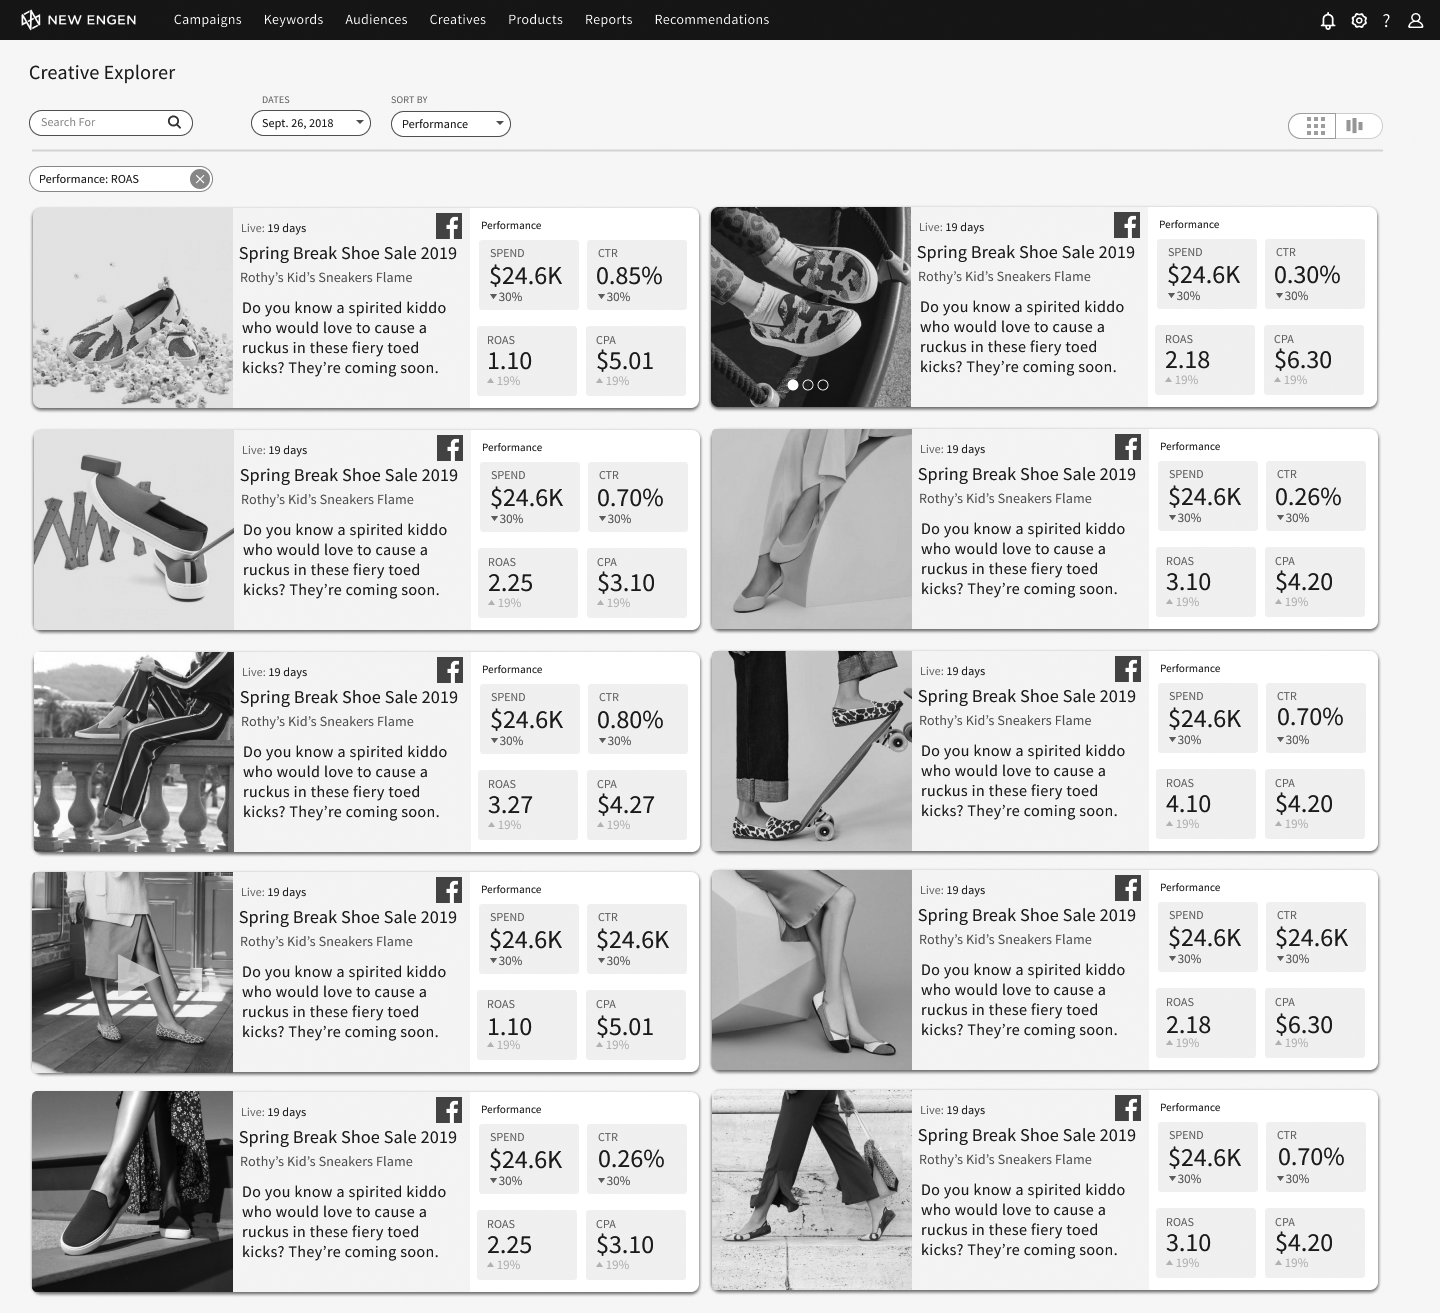
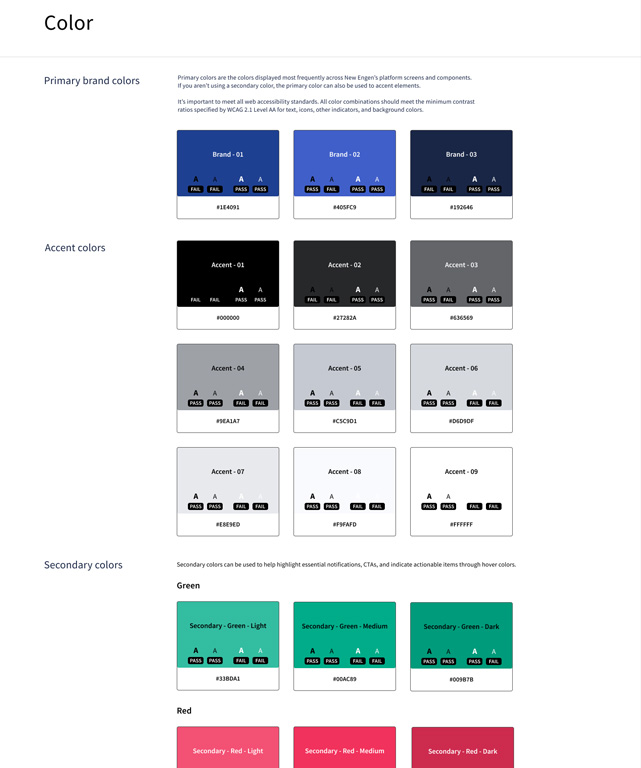
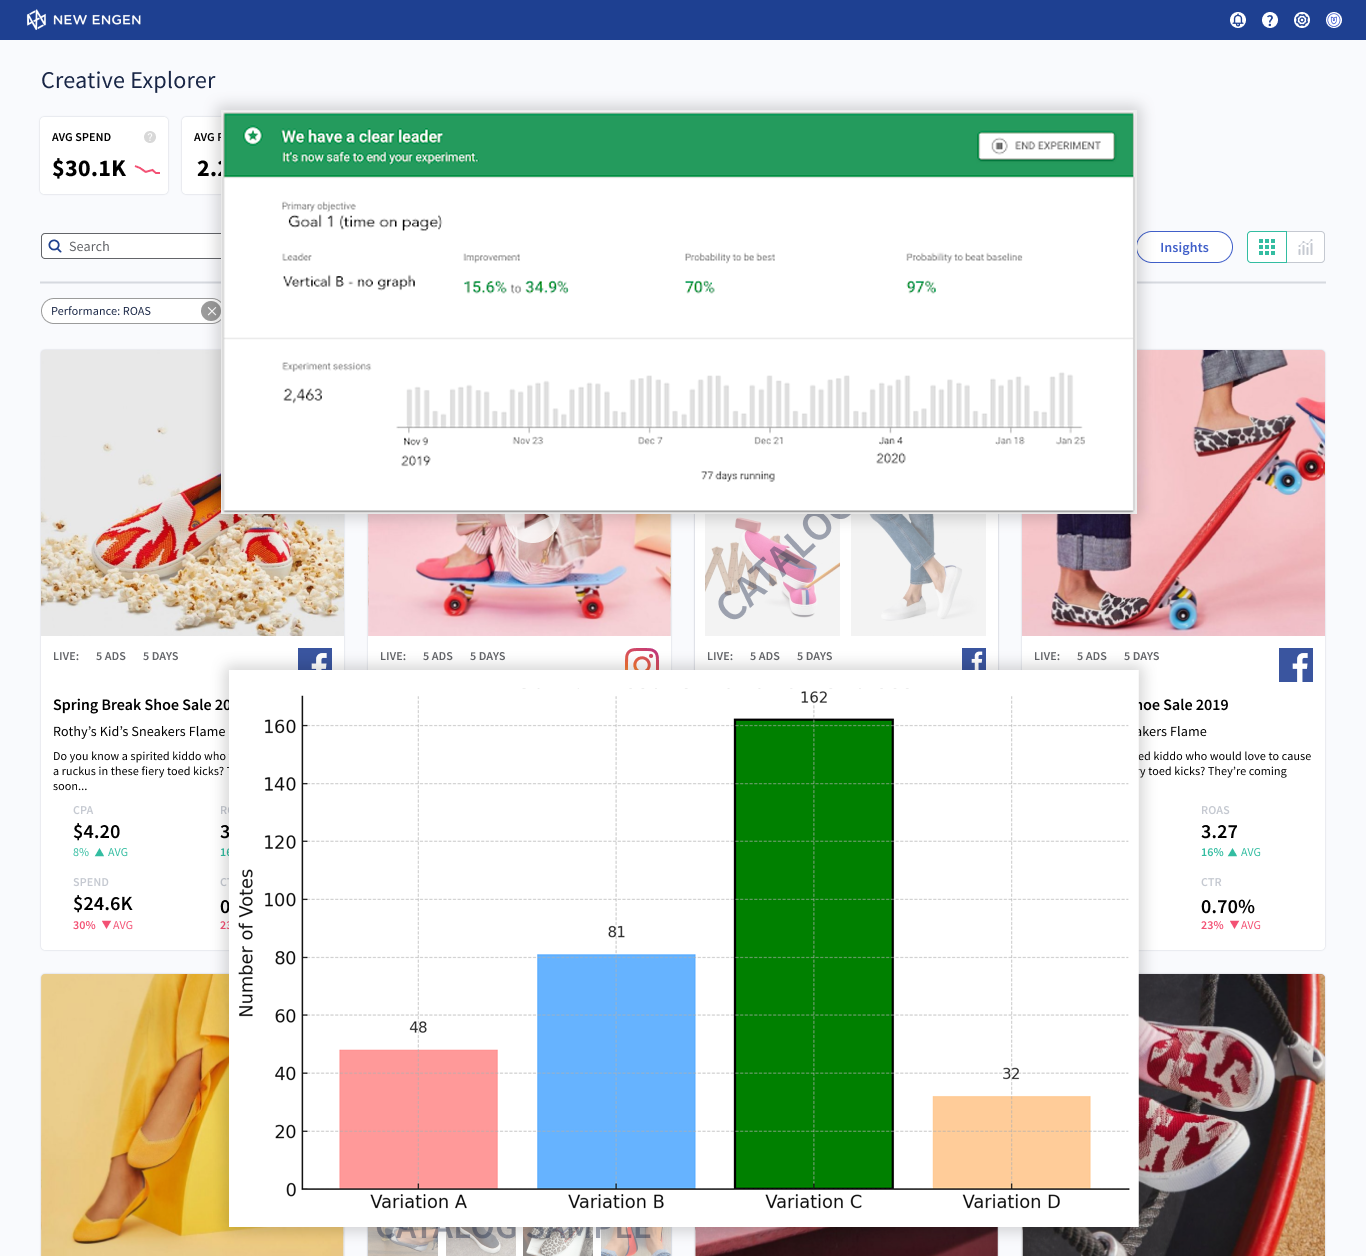
  1. Identified key metrics such as; CTR (click-through rate), Conversion Rate, CPC (cost per click), ROAS (return on ad spend) and Engagement Metrics (Likes, Shares, Time on Page, Impressions and Bounce Rate). We also highlighted the importance of Platform-specific Metrics (Search, Social, Shopping, Programmatic, Mobile) to tailor insights accurately.
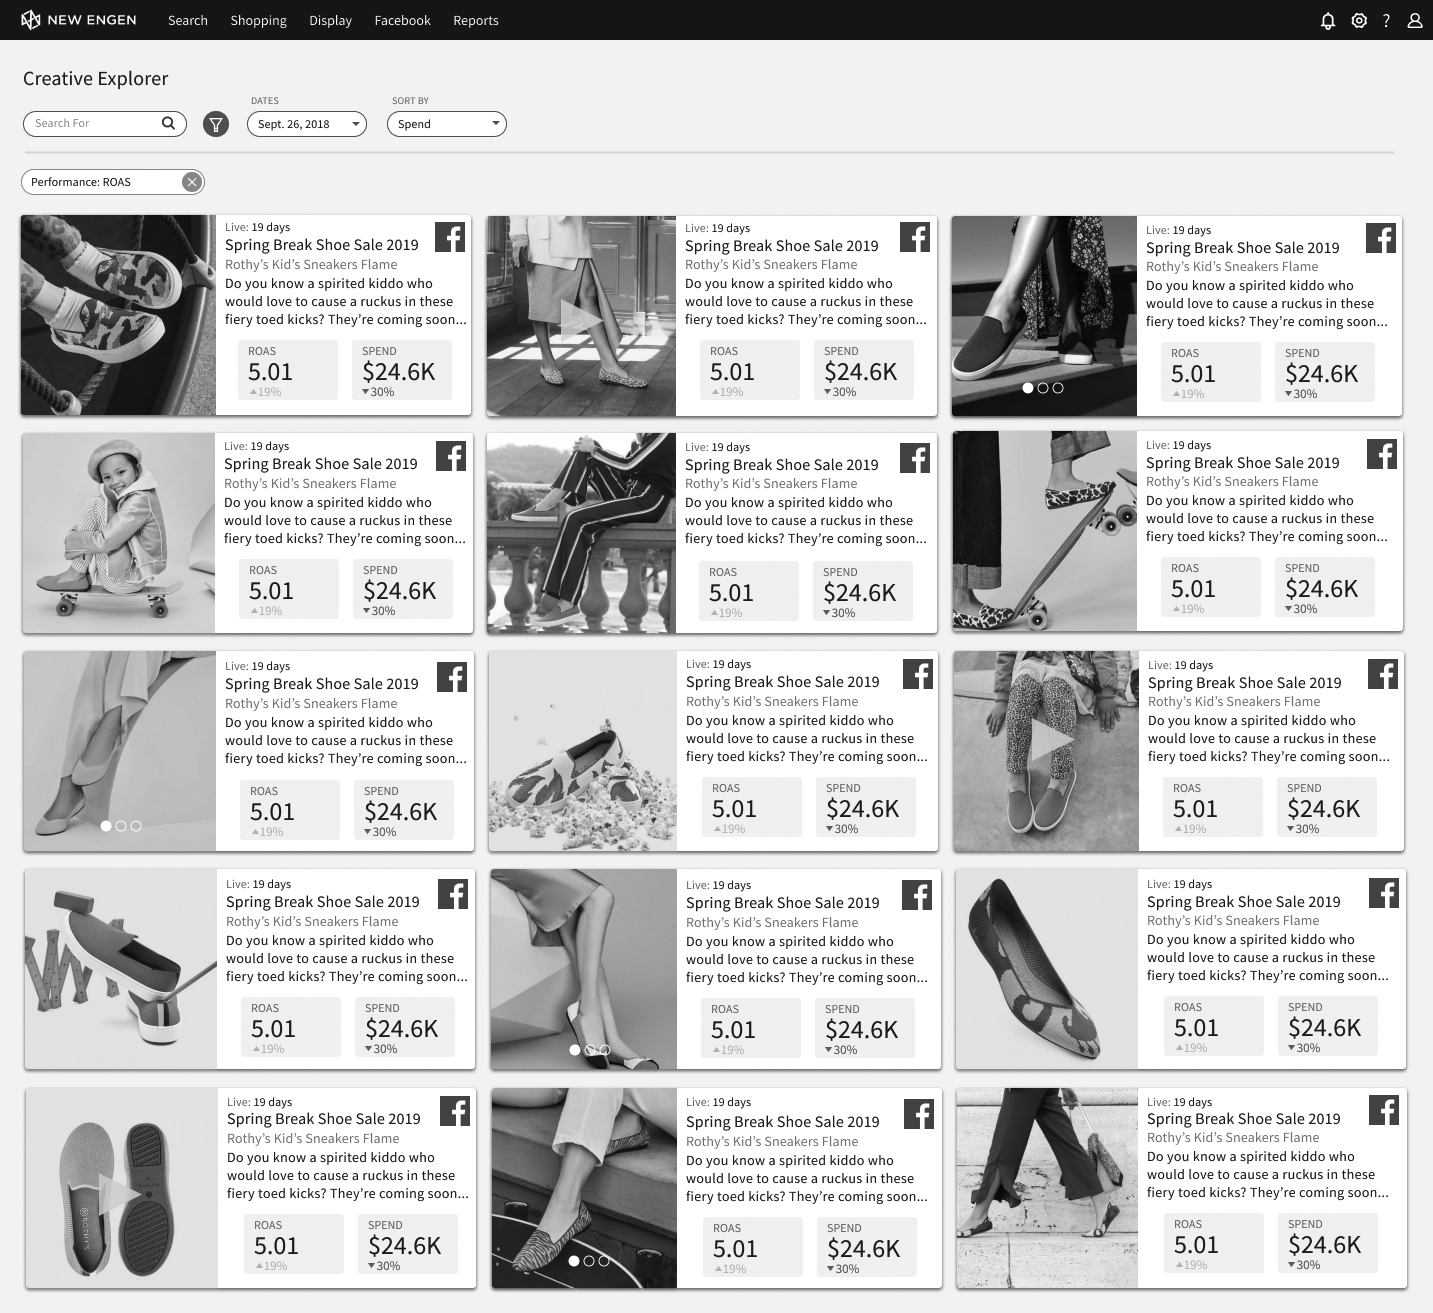
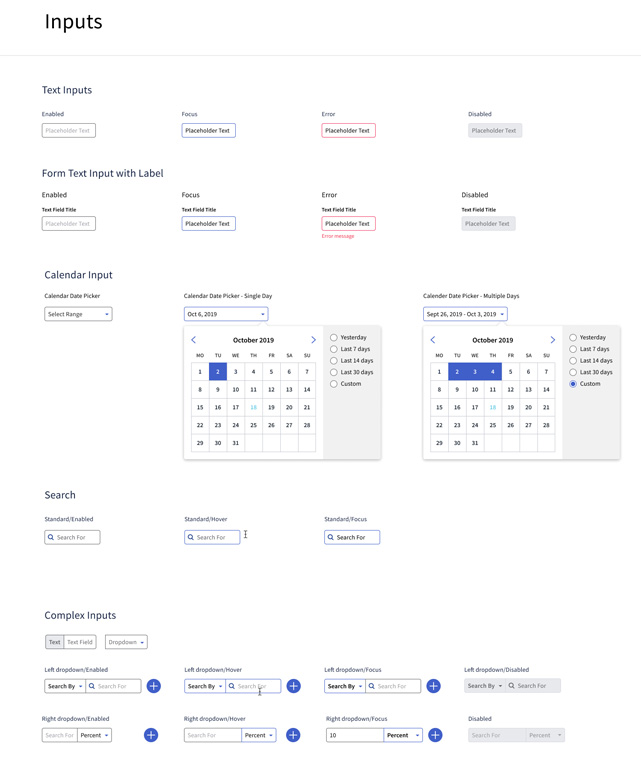
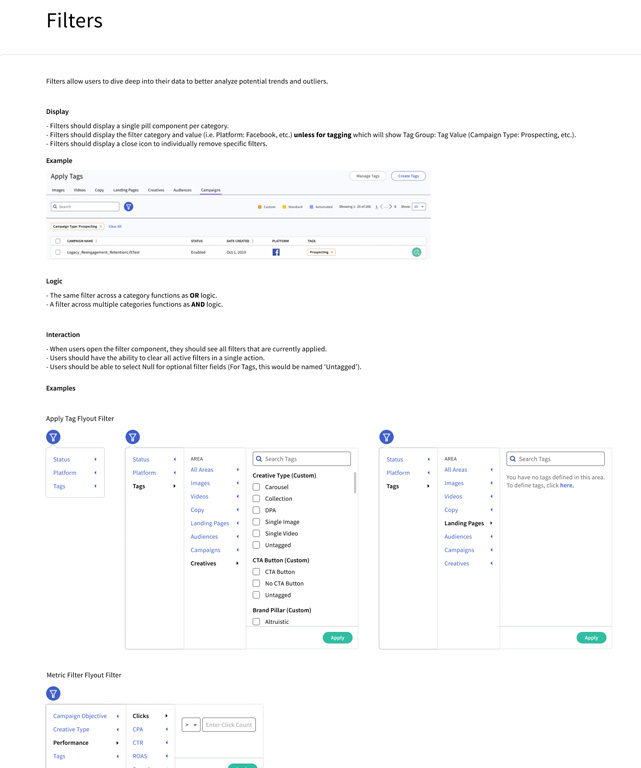
  2. Emphasized the importance of advanced searching and filtering to be able to find and parse large amounts of historical data.
  3. Explored ways to standardize reporting metrics and visualizations across different ad platforms to provide a cohesive view.
  4. Highlighted the importance of comparing individual ad performance against the fleet of other ads and campaigns.
  5. Emphasized the need for real-time data updates and the ability for users to customize and save views/reports.
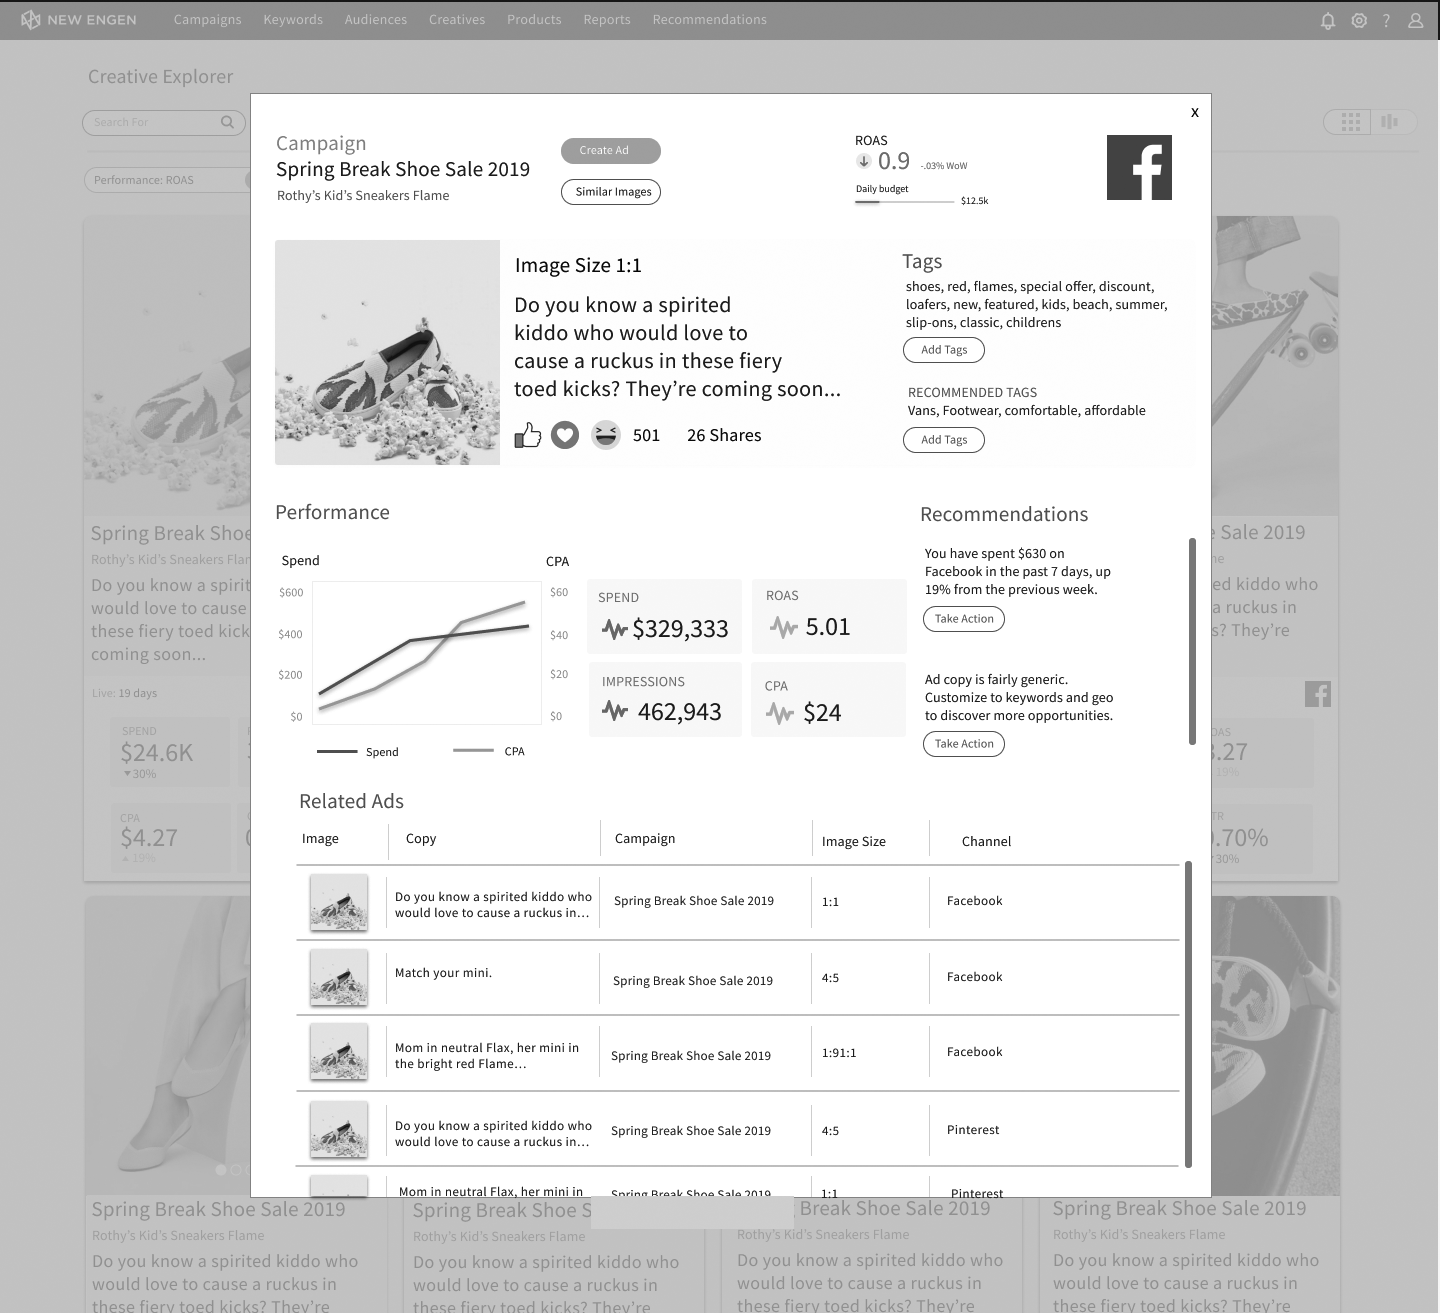
  6. Discussed how the tool could provide actionable insights & recommendations based on data trends. Integrating AI - Machine learning suggestions such as:
    • adjusting ad spend based on different performance metrics
    • targeting content tweaks & recommendations such as; too generic copy, image improvements, better cta etc.
    • auto-tagging ads to improve performance
    • suggesting ad variants to test headlines, copy, imagery, and call to action
    • recommend negative keywords to increase ad efficiency
    • review ads pre-launch for campaign consistency and platform compliance
    • conduct a thorough responsive design test to ensure seamless UX across all devices
    • alert when ad spend is over or under allocated budget and is properly algined with desired ROI
    • rank the best to worst performing campaigns and ads across each platform
    • adjusting bid modifiers to better target demographic segments, example:
      • Women, Age 25-34: +30% bid modifier
      • Men, Age 18-24: -10% bid modifier
      • Household Income Top 10%: +20% bid modifier


> 2. UX Design

Concept Wireframes

Creative Explorer Concept Wireframes

Creative Explorer Concept Wireframes

Creative Explorer Concept Wireframes


Design System

The UX Team created and maintained a Design System that documents all Styles, Components & UX Patterns. We worked closely with Engineering to build-out a CSS repositiory that housed the styling and code for each element, and co-owned updating the repository when elements were added, changed or removed. Some examples below:

Design System Styles
Design System Components
CONSTRUCT Pattern Library


Visual Design


Prototyping

Before every feature release we build prototypes to test the proposed interactions with users. Prototypes are also used to review with stakeholders for feedback and buy-off.

The following is an example (FIGMA URL):
Filtering & Tagging Ads in Creative Explorer


> 3. UX Testing

Usability Study & Test Kit

After every launch we conduct a Usability Study in order to get insights into how well users are able to complete tasks along with their overall satisfaction using the application.

We recruited the following internal candidates and remote SaaS customers to take the study:
8 SaaS Marketing Team users
6 Internal Performance Marketers
3 Internal Graphic Designers
2 Internal Copywriters

From our research we were able to determine that user's had a successful task completion rate of 82% and the application had an initial SUS score of 77. We plan to test again in 4 months and will use these baseline scores and will monitor as more users adopt the tool.

Usability Study & Test Kit (PDF)

Test Result Metrics:

Task Success Rate: 85%
Task Completion Time: Average of 4 minutes per task
Error Rate: 2 errors per participant on average
Learnability: Participants took an average of 10 minutes to become proficient with the application
SUS Score: Average score of 77 out of 100
Participant Feedback: Positive feedback on ease of use, but some participants noted confusion with the filtering, and there was a clear tile layout preference
Feature Usage: Most frequently used feature was the search function, utilized by 90% of participants
Navigation Path Analysis: Majority of participants followed a similar path:
landing page >> search/filtering >> ad tile details >> task completion >> toggle view
Usability Issues Identified: 12 usability issues identified, with the most common being unclear labeling
Overall Satisfaction: Average satisfaction rating of 4.2 out of 5

Recommended Improvements:

1. Improve initial product orientation: Add better contextual help, and a first-run welcome tour
2. A/B testing results: Implement vertical tile layout, which was overwhelmingly preferred by users
3. Improve discoverability: Consider alternative affordance options for clicking into tile details such as: hover styles, peek feature, and progressive disclosure
4. Help text: Users struggles to1 recall what the different graph parameters met, provide definitions and examples for them to access
5. Accessibility review: Check color contrast and alternatives to ensure graph readability, improve labeling for screen readers, and test tab order and keyboard interactions


A/B Testing

Tile design was a super important and also super divided topic amongst stakeholders. To determine the most effective UI design and content layout, we created multiple versions and conducted A/B testing using Google Optimize. Our goal was to present users with the most important content and information in the easiest way to read.

We defined several UX goals to evaluate the success of each layout, including:

  1. Readability: Ensuring that users could easily read and understand the content.
  2. Engagement: Measuring user interaction with key elements of the layout.
  3. Navigation: Assessing how intuitively users could navigate through the UI.
  4. User Satisfaction: Gathering user feedback to determine overall satisfaction with the layout.
A/B Testing Variant 1
A/B Testing Variant 2


A/B Testing Variant 3
A/B Testing Variant 4


First Run & Welcome

At launch we included a first run and onboarding tour to orient users with the main features and benefits of the application.

Creative Explorer Concept Wireframes

Creative Explorer Concept Wireframes

Creative Explorer Concept Wireframes

Next Steps

After the successful launch of the Minimum Viable Product (MVP), I maintained active collaboration with stakeholders and product managers to prioritize essential upcoming features. Simultaneously, I closely collaborated with engineers to optimize performance, resolve bugs, and integrate forthcoming AI - Machine Learning functionalities.

    For Later releases:

  • Allow users to "Save Their Views"
  • Provide users with "Predefined Quick Views"
  • Give users the ability to "Export Views as Reports"
  • Improve search and filtering performance
  • Create & Groom feature backlog for AI - Machine Learning

Let's Work Together!

I am currently based in Seattle.
I love to travel and can meet you anywhere in the world.